[fancy_header3 textColor=”#25b6eb”]Open Source Flow Monitoring and Visualization[/fancy_header3]
At the heart of any reasonably sized network, should be a solid strategy around flow collection, querying and visualization. Proper use of flow logs are crucial to SecOps/NetOps from triaging attacks to capacity planning and traffic trending. I remember some 20 years ago, the first time I saw flow logs being visualized in rrdtools it was pretty close to magic. I wanted to recreate that environment a few years back and it felt pretty dated.
Recently, I decided to poke around and see what’s new in the open source monitoring space of sFlow/NetFlow/IPFIX and ran across a couple of interesting projects, cloudflare/goflow (CloudFlare OSS), VerizonDigital/vflow (Verizon OSS) and robcowart/elastiflow (also deserving of a mention here is pmacct). GoFlow and vFlow are both written in Go which I like and both appear to be highly scalable collectors. What they don’t have are built-in front ends so will require a bit more work to extract interesting data.
Since most ops are already have a workload that doesn’t allow for weeks of development that a Verizon or CloudFlare would staff would have, I thought it would make sense to highlight Elastiflow, since it’s a nice end to end out of the box OSS solution, that’s easy to get up and running.
[fancy_header3 textColor=”#25b6eb”]Installation and Testing[/fancy_header3]
The order of setup and validation is as follows:
[fancy_list style=”circle_arrow” variation=”orange”]
- Prep the target system (Linux) with a couple of dependencies. The Linux VM is 4-core and 8GB of mem on a laptop. ELK stack is not trivial on the resources and was sluggish on a laptop VM.
- Bring up the classic ELK stack consisting of Elasticsearch, Logstash and Kibana.
- Provision the Elistiflow Java component.
- Validate the flow collection and visualization with a tool I wrote to generate Netflow data nerdalert/nflow-generator or if you have some switches with traffic, point them to the collector
- Quick crash course in Kabana.
[/fancy_list]
The install is pretty simple since it is containerized. Depending on the size of your network (i.e. flows generated and exported) and the various moving parts here, the easiest scenario for you to troubleshoot should determine how you deploy, whether inside or outside of containers. For the easy setup and demo we will use the docker-compose.yml file included in the project. There were a few things unclear in the docs so I am jotting down what worked for me in setting it up.
[fancy_header3 textColor=”#25b6eb”]ElastiFlow Installation[/fancy_header3]
On a Linux host, install Docker and Docker Compose if it’s not already on the system:
|
1 2 3 4 5 6 7 |
# Docker install sudo apt-get install docker.io # Docker Compose install sudo curl -L "https://github.com/docker/compose/releases/download/1.25.0/docker-compose-$(uname -s)-$(uname -m)" -o /usr/local/bin/docker-compose sudo chmod +x /usr/local/bin/docker-compose |
Download the latest release tarball or zip. Using the master branch image doesn’t build. I’m assuming by design as opposed to neglect while its under development ¯\_(ツ)_/¯. The following is documented in the project here.
|
1 2 3 4 5 6 7 |
# Download the latest release (currently): # https://github.com/robcowart/elastiflow/archive/v3.5.1.zip # All releases: https://github.com/robcowart/elastiflow/releases unzip v3.5.1.zip cd elastiflow-3.5.1 |
The compose file mounts the local fs for writing data out. Run the following to prep the filesystem.
|
1 2 3 4 |
sudo mkdir /var/lib/elastiflow_es sudo chown -R 1000:1000 /var/lib/elastiflow_es |
Start the compose stack with:
|
1 2 3 4 5 6 |
sudo docker-compose up -d Creating elastiflow-elasticsearch-oss ... done Creating elastiflow-logstash-oss ... done Creating elastiflow-kibana-oss ... done |
The collector ports listen on the following ports:
|
1 2 3 4 5 |
ELASTIFLOW_NETFLOW_IPV4_PORT: 2055 ELASTIFLOW_SFLOW_IPV4_PORT: 6343 ELASTIFLOW_IPFIX_TCP_IPV4_PORT: 4739 |
[fancy_header3 textColor=”#25b6eb”]Validate the Installation[/fancy_header3]
The project uses —net=host so the ports will get bound to the systems IP address. This is all configurable in the compose file if you fork it. Assuming you don’t get any errors, you should see some new listening ports bound to 0.0.0.0. Below is a dump from my host as a reference.
|
1 2 3 4 5 6 7 8 9 10 11 12 13 14 |
netstat -pln Active Internet connections (only servers) Proto Recv-Q Send-Q Local Address Foreign Address State PID/Program name tcp 0 0 127.0.0.1:34547 0.0.0.0:* LISTEN 1401/containerd tcp 0 0 127.0.0.53:53 0.0.0.0:* LISTEN 415/systemd-resolve tcp 0 0 0.0.0.0:22 0.0.0.0:* LISTEN 546/sshd tcp 0 0 0.0.0.0:5601 0.0.0.0:* LISTEN 6131/node udp 0 0 0.0.0.0:2055 0.0.0.0:* 6115/java udp 0 0 0.0.0.0:6343 0.0.0.0:* 6115/java udp 0 0 127.0.0.53:53 0.0.0.0:* 415/systemd-resolve udp 0 0 192.168.1.17:68 0.0.0.0:* 391/systemd-network udp 0 0 0.0.0.0:4739 0.0.0.0:* 6115/java |
Next start pushing some flows into the collector so we can start populating so flows to view running the following container. You can also grab binaries or build it yourself here nerdalert/nflow-generator
|
1 2 3 4 |
# HOST_IP is the IP of the host running the collector sudo docker run -it --rm networkstatic/nflow-generator -t HOST_IP -p 2055 |
While that runs in the background, validate the installation by making sure we can reach the Kibana UI by pointing your browser to http://HOST_IP:5601/app/kibana where HOST_IP is the machine running the ELK stack.
[fancy_list style=”circle_arrow” variation=”orange”]
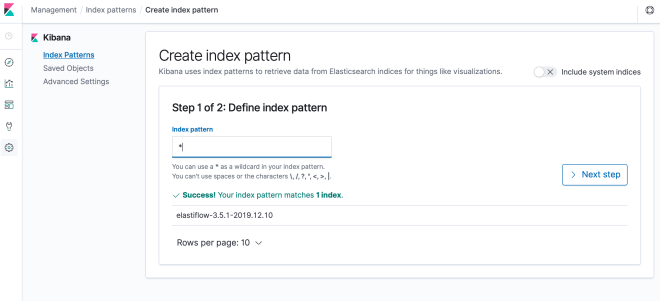
- Once the page loads, go to Management -> Index Patterns -> Create Index Pattern. Just pop a star/wildcard in the box and hit next step until done like so:
[/fancy_list]
Now we need to import some dashboards, which is one of the things I really like about this project is that it has a nice collection ready for import. Download one of the dashboard templates from github.com/robcowart/elastiflow/tree/master/kibana. I used elastiflow.kibana.7.3.x.ndjson for this to match the v3.5.1. release timeframe.
[fancy_list style=”circle_arrow” variation=”orange”]
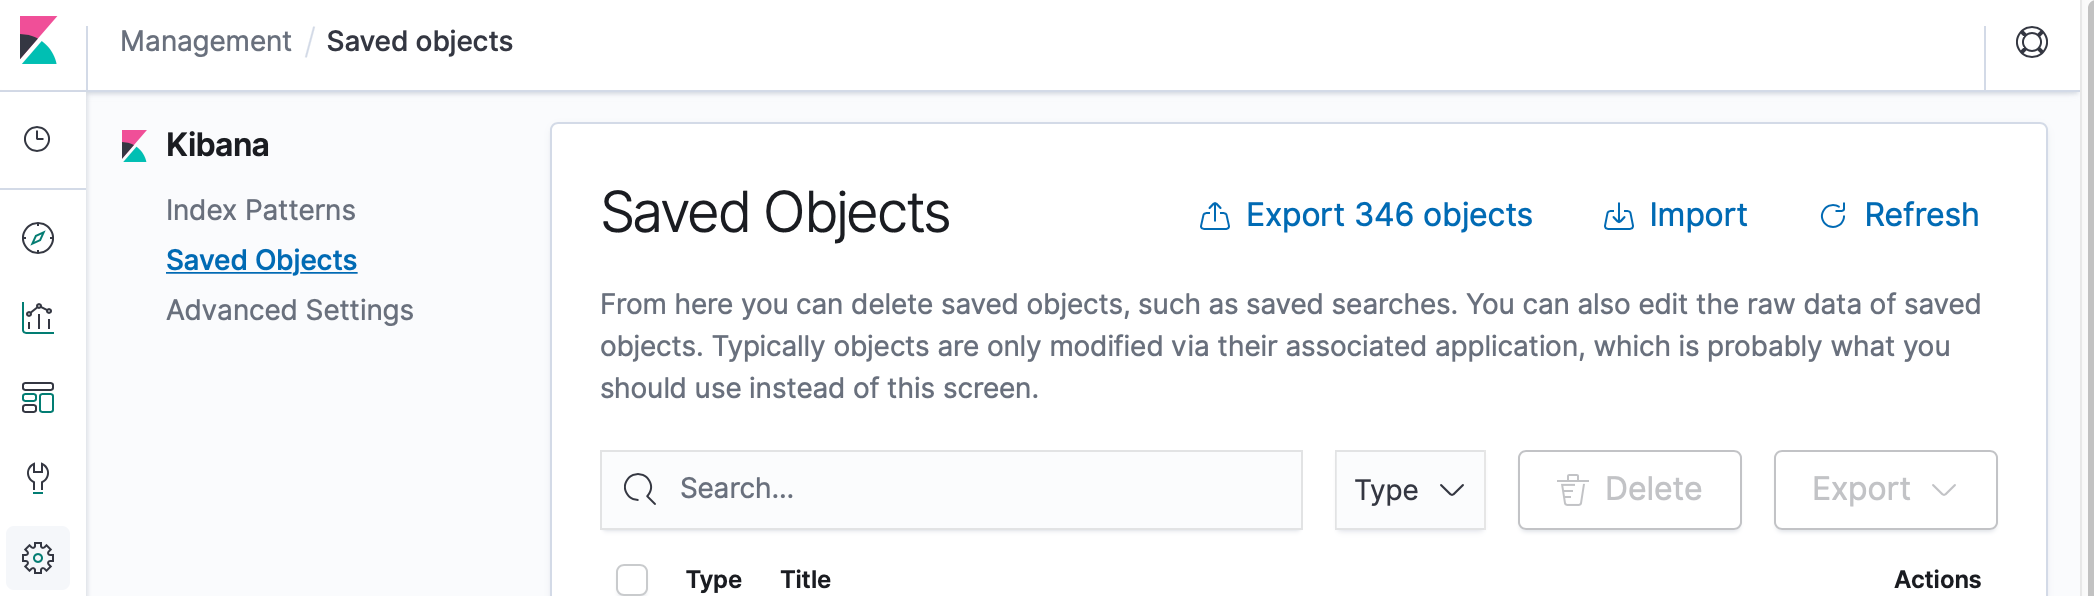
- Go to Management -> Saved Objects and click import and upload the elastiflow.kibana.7.y.x.ndjson file you downloaded.
[/fancy_list]
[fancy_list style=”circle_arrow” variation=”orange”]
- Once those import, you should now have a 300+ imported dashboards.
[/fancy_list]

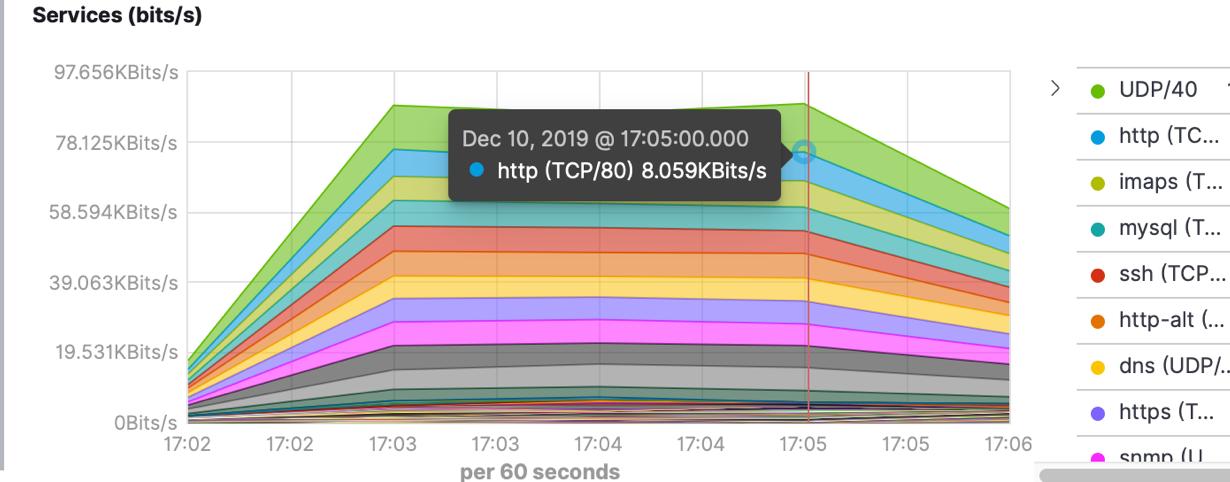
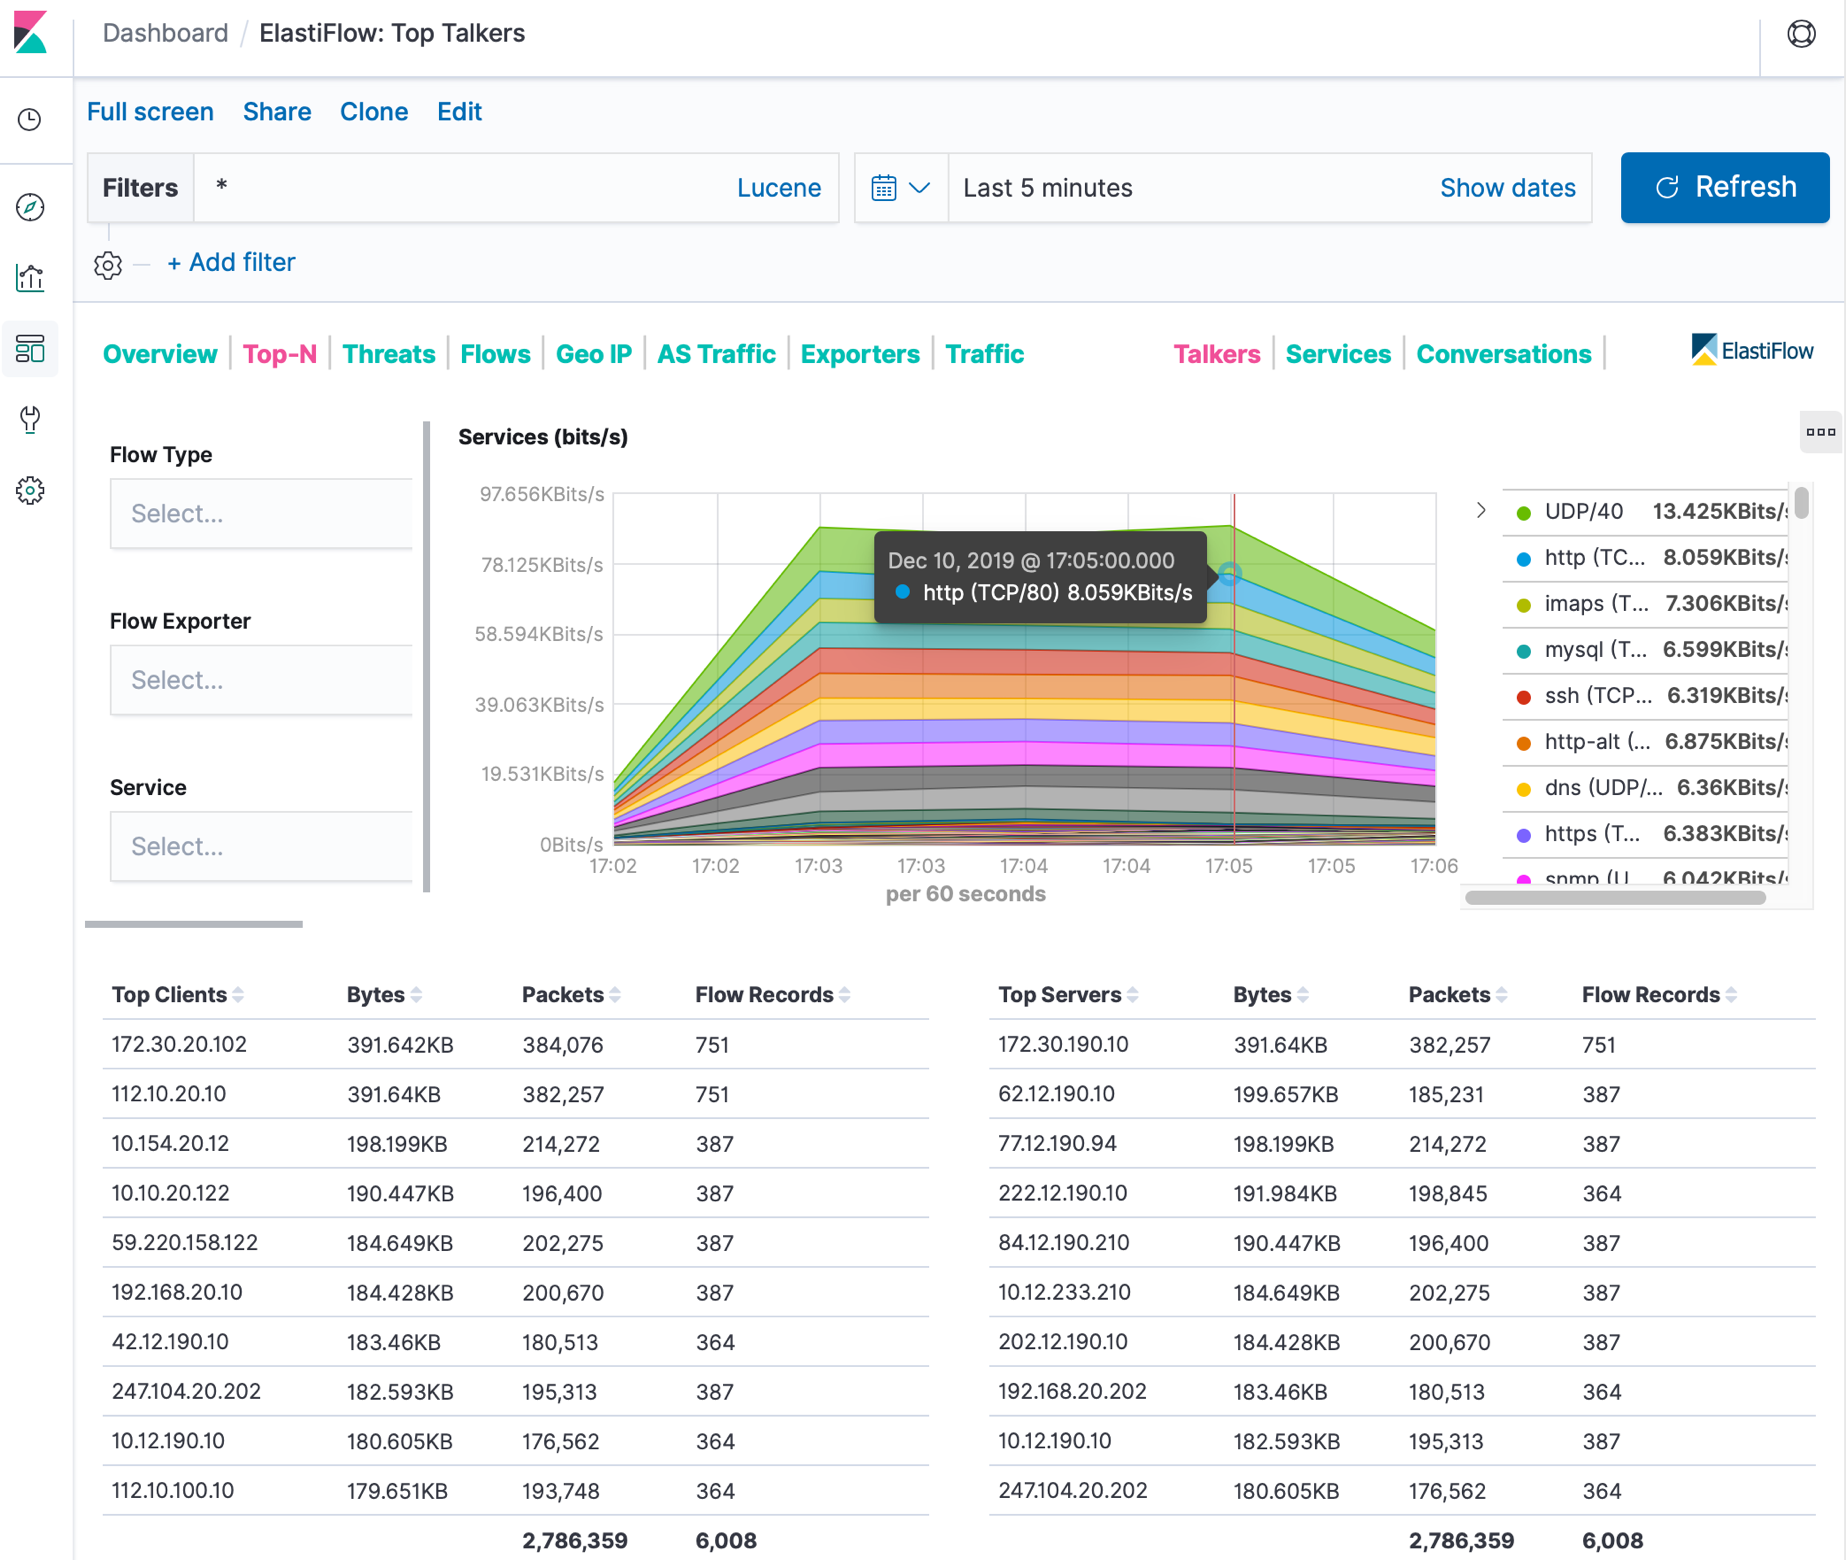
Now you can bedazzle your colleagues with the glorious Kibana visualizations by simply clicking on any of the saved objects in the list. The flow data is in the following examples is just random Netflow flows injected from nerdalert/nflow-generator.
[fancy_list style=”circle_arrow” variation=”orange”]
- Dashboard Name – ElastiFlow: Top Talkers
[/fancy_list]
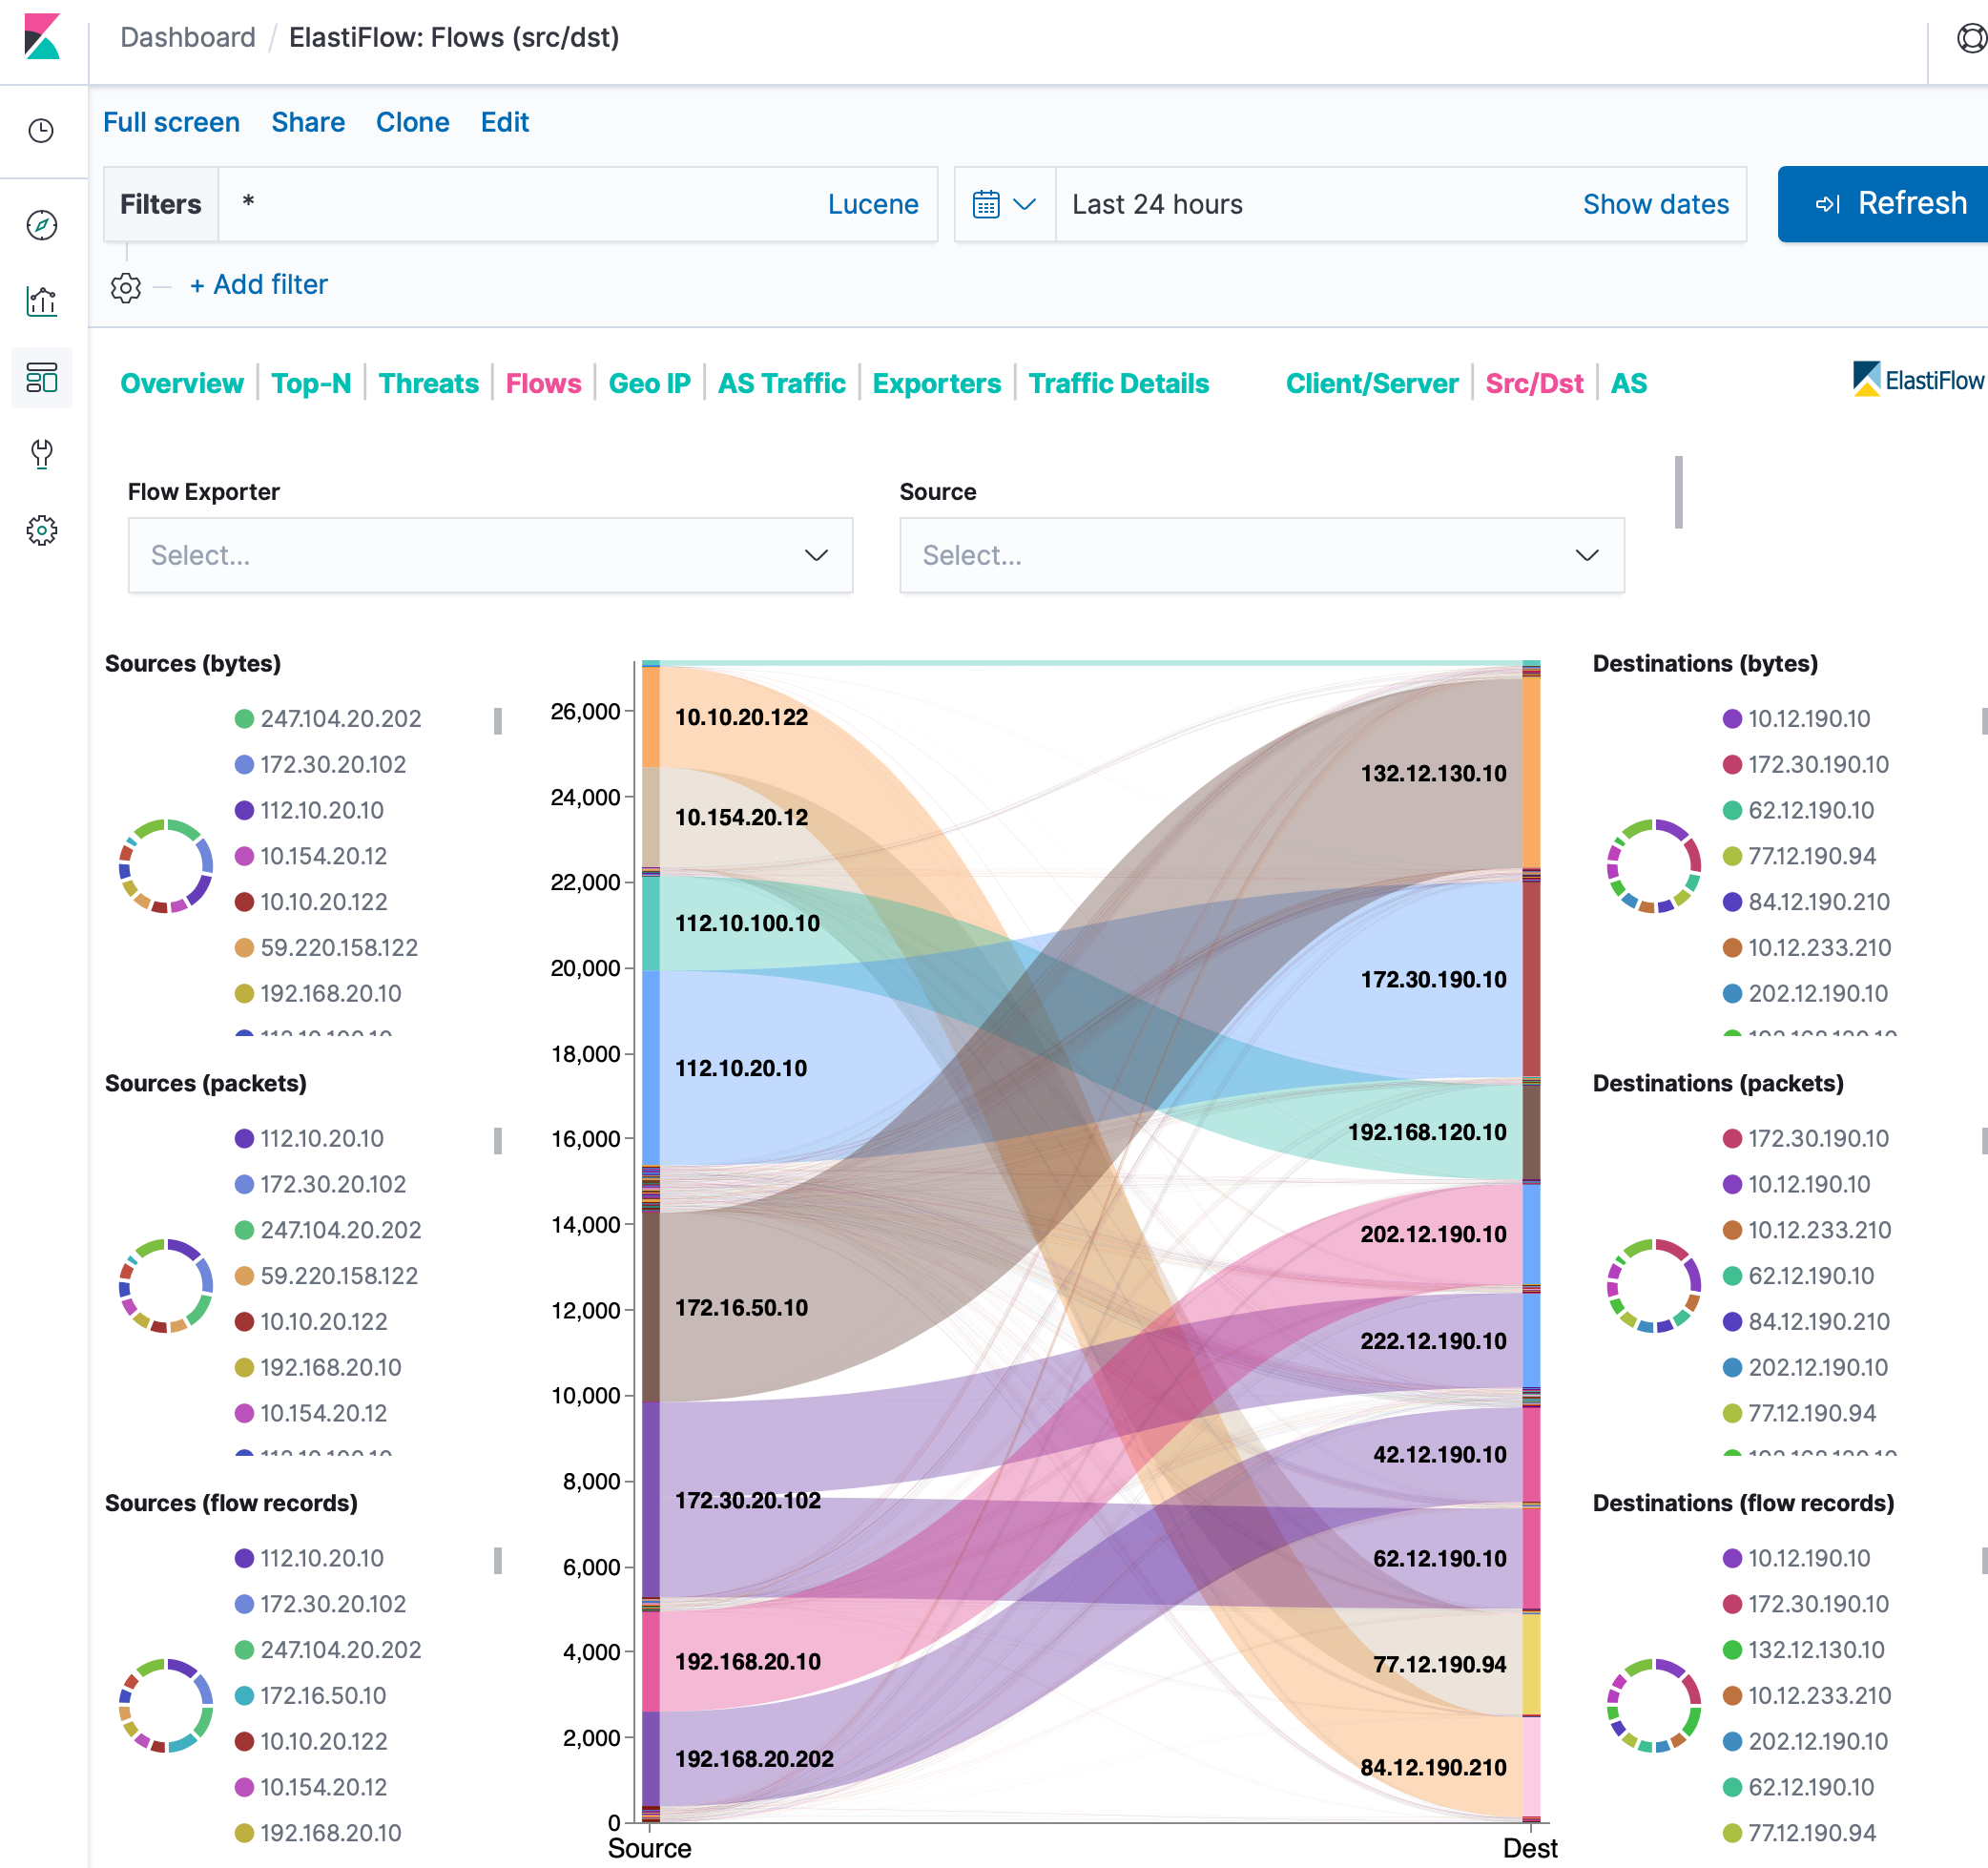
[fancy_list style=”circle_arrow” variation=”orange”]
- Dashboard Name – ElastiFlow: Flows (src/dst)
[/fancy_list]
[fancy_list style=”circle_arrow” variation=”orange”]
- Dashboard Name – ElastiFlow: Geo Location (src/dst)
[/fancy_list]

[fancy_header3 textColor=”#25b6eb”]Wrap Up[/fancy_header3]
That’s all for now. Thanks to github.com/robcowart for the work in putting together and open sourcing this nice end to end flow management project. If you run into issues or improvements, I am sure he is open to accepting PRs. I know I will open a couple to help contribute.
If you have any networking projects you would like highlighted or looking for contributors, I am always interested. Ping me at @networkstatic and let me know what you’re working on!